|
Every week or so an article will be added to the site.
In the Future...
June 23, 2005
It has occured to me that I have conducted a lot of research into defense-independent pitching.
The MLDIP was created earlier this year, and I have come by a great deal of data on the subject. Fantastic studies have been
put together from all corners of the sabermetric community regarding the subject and have come to many different conclusions
but one in general: the theory works.
As of the last time I visited a book store or scanned Amazon.com for titles, I have never
seen a book on defense-independent pitching. For such a debated toic in the baseball world, it surprises me to a great extent
that no one has ever published.
My good friend was the first to introduce the idea of me authoring a book--more of a collection
of essays, really--covering all reaches of the defense-independent world. The essays would link the different papers done
by staticians and economists and sabermetric enthusiasts, providing an objective view of pitching.
The expectations for this so-called book are not unreasonably high. With the help of
my friend's computer knowledge, we are hoping to self-publish, and sell them ourselves.
I don't like to think of it as a book--books are usually meant to be entertaining and make
a lot of money--but as a report. It will be a collection of statistical knowledge that I have decided to gather
for my education on the topic and for others.
Note(s): A) You can request a copy of the report when it's completed by e-mailing
me.
B) The work on the
report will be pretty time consuming, so do not expect to see a large number of posts during the time it will be written.
Old Article
June 13, 2004
Here's an old article I posted sometime in January; on a previous, unsuccesful blog. It comment's
pretty well on Billy Beane's pitching strategy.
Trading
Away the Big Three
It's very funny. Since the very minute that the Tim Hudson
trade to Atlanta went through, people have been criticizing Billy Beane for splitting ways with his aces, saying the Oakland
A's are about to go down the tubes for many years to come. The thought of this being a bad deal never crossed my mind. If
you analyze the two trades "sabernomically," you will find Billy Beane used the Moneyball theory to really take advantage
of our starting pitcher-friendly market.
Over the last few weeks it is evident that starting pitchers are making much
more than was predicted and even more than they deserve. (These salary numbers being in million dollars per year) Radke signed
for nine, Benson 7.5, Russ Ortiz just north of eight, Martinez almost 14, and Pavano with 10. Many of these are more than
what is said to have been deserved or predicted, indicating an inflated market for starting pitchers.
So what what
did Beane do when his Big Three drew interest from other clubs? He saw the market condition and realized how much he could
get for them. Beane's payroll is only around 50 million dollars so he uses the Moneyball philosophy. What this means is he
uses economic principles and therefore, is usually going against the market (or tries to get what is undervalued). It is sort
of like owning a stock, you buy low and sell high. Beane drafted his aces (low) and sold them when they were most valued (high).
Well,
what did Beane pickup? As I said Beane sold high and got an amazingly good deal. The Cardinals and Braves valued Mulder and
Hudson so much they gave up more than they probably should have, leaving Beane making out like a bandit.
In the Hudson
trade Beane received an up-and-coming pitcher (lefty Dan Meyer: good defense independent pitching, we'll get into that very
extensively another time), a 24 year old strikeout pitcher who can handle loads of innings at a time (Juan Cruz), and outfielder
Charles Thomas who will most likely serve as a fifth outfielder (good defense but a low OBP). Also this opens up the way for
some of his great minor-league pitching. In this deal Beane picked up a lot of young talent for a pitcher he could only keep
for one more year.
And I love what Beane got from the Cardinals. He traded Mark Mulder (who didn't have his best year
in 2004) for young righty Danny Haren (Haren is one of the top young pitchers in the game), reliever Kiko Calero, and an amazing
catching prospect Daric Barton (Barton led his minor-league division in OBP and came in second for SLG). This trade was the
icing on the cake for me.
Overall I sum it up like this: the A's freed up $12 mil (they did give up two aces though)
to bolster their bullpen, and gain a whole lot of young talent. The A's really dominated the last few weeks (also the Jason
Kendall move) and have become younger and cheaper. I love this deal for the A's and it is a great example of what Moneyball
is all about.
Too bad the A's aren't doing very well this year. I will still uphold my position that they
are set to be succesful in the near future, however.
Runs, Games,
and Logarithms
June 8, 2005
So far in my
quest to answer Moneyball's postseason predicament, I have come up with the information
verifying that player's and teams' short-term performance is random; and will eventually regress to a mean. I mused earlier
that once this foundation is laid down, further data analysis can build up the playoff question to higher and higher levels.
Now knowing that short-term data is loaded with noise and randomness--a batter with a .300 batting average doesn't actually
get a hit three out of every ten times--it is safe to continue.
About one week
ago I formulated, if you don't mind me saying so, a very good question. I recognized that Billy Beane's real problem with
the playoffs was that they are too short; there is not enough time for team performance to average out and distinguish the
good from the bad. Then, I ask, how long does it take for the good and the bad to differentiate? How many games is it until
the San Diego Padres pull away from the seemingly lucky Arizona Diamondbacks? This is the real question. If an 11-19 game
postseason is long enough for a true champion to rise up, then the Moneyball take must be wrong, but if the number is, say
30, or even 100 games, then the Oakland A's are right and can continue to blame there playoff woes on luck.
In order to
make an analysis and find a solution to this question, you need two things: appropriate data and a fitting test. For about
a week I puzzled over both and after hours of toiling over a desk while scribbling on a notepad, things started becoming clear.
After gathering game-by-game scores from baseballreference.com, I could then take the number of runs above
average that each team scored on a game-by-game basis. For example, Team A may have been 3 runs above average after 20 games,
5 runs below average after 21, and 19 runs above average after 138. Then by using a predictive logarithmic function (my test),
I could see where a good team starts to pull away (in runs above average), and a bad team starts to fall off.
Because
the data is scattered across the web, it will take some time to import it. This, along with my pitch selection study, will
be a decently long project. I hope to get out some basic, preliminary results in the next couple weeks; complemented by some
shorter studies in between.
This
is a very tricky issue and deserves careful attention. My procedures and tests may change radically according to how the data
turns out, and I’ll have to keep my guard up—but I’m still fairly confident that a logarithmic function
can still tell much despite its faults.
Hitting Streaks and Lousy Slumps
May 28, 2005
My last article (written an entire week ago), introduced Moneyball's view of the
postseason. (Refresher: Michael Lewis states in the book that Oakland Athletic's GM Billy Beane believes that the playoffs
are completely luck. Beane argues that their are not enough games played to show how good a team really is; therefore a mediocre
wild-card team could be in a hot streak, and win, while a strong division winner may be "cold" and not perform at their true
ability). I hypothesized that the A's take on the playoffs is true, and set out to on a mission to answer the "postseason
problem."
But when attempting to solve this conundrum, you are forced to split your analysis into two
parts: establishing that randomness in hot and cold streaks exist, and then finding a correlation between performance over
a large data sample compared to the postseason. In order to show that the playoffs are not long enough to crown a "true champion,"
it first needs to be proven that teams and players perform by streaks. These assumed, so-called "streaks" look like this:
at some points during the regular season a player is hitting well, and other times not so well, but over the long run the
performance of the streaks regress to an average, which is the true benchmark when analyzing how good a player/team is.
Speculation and making assumptions is cheap, and data analysis is where the answer lies. Using
MLB.com's team month-by-month 2004 hitting data, I constructed a spreadsheet showing each team's OPS by month (i.g. March
and April, July, September and October). Here it is:
| 2004
Monthly OPS |
|
|
|
|
|
|
|
|
| Team |
Mar+Apr |
May |
Jun |
Jul |
Aug |
Sep+Oct |
Entire Year |
Monthly Avg |
|
| Texas |
0.864 |
0.769 |
0.81 |
0.774 |
0.771 |
0.747 |
0.786 |
0.786 |
|
| Minnesota |
0.836 |
0.689 |
0.721 |
0.77 |
0.802 |
0.772 |
0.763 |
0.763 |
|
| Baltimore |
0.791 |
0.792 |
0.732 |
0.749 |
0.795 |
0.795 |
0.776 |
0.776 |
|
| Cleveland |
0.805 |
0.758 |
0.797 |
0.82 |
0.853 |
0.736 |
0.795 |
0.795 |
|
| St. Louis |
0.861 |
0.715 |
0.782 |
0.873 |
0.827 |
0.779 |
0.804 |
0.804 |
|
| Los Angeles |
0.782 |
0.717 |
0.751 |
0.825 |
0.76 |
0.706 |
0.755 |
0.755 |
|
| Kansas City |
0.805 |
0.683 |
0.707 |
0.663 |
0.759 |
0.715 |
0.72 |
0.72 |
|
| Houston |
0.814 |
0.781 |
0.703 |
0.759 |
0.82 |
0.791 |
0.778 |
0.778 |
|
| Chicago A |
0.829 |
0.814 |
0.871 |
0.669 |
0.777 |
0.781 |
0.79 |
0.79 |
|
| Pittsburg |
0.755 |
0.802 |
0.662 |
0.717 |
0.725 |
0.682 |
0.722 |
0.722 |
|
| Colorado |
0.866 |
0.774 |
0.737 |
0.878 |
0.774 |
0.783 |
0.8 |
0.8 |
|
| Detroit |
0.763 |
0.823 |
0.798 |
0.79 |
0.793 |
0.747 |
0.786 |
0.786 |
|
| Anaheim |
0.773 |
0.782 |
0.728 |
0.801 |
0.803 |
0.735 |
0.77 |
0.77 |
|
| Chicago N |
0.837 |
0.748 |
0.777 |
0.76 |
0.822 |
0.782 |
0.786 |
0.786 |
|
| San Diego |
0.747 |
0.72 |
0.682 |
0.78 |
0.808 |
0.787 |
0.756 |
0.756 |
|
| Florida |
0.776 |
0.743 |
0.707 |
0.743 |
0.739 |
0.716 |
0.736 |
0.736 |
|
| Atlanta |
0.763 |
0.708 |
0.759 |
0.815 |
0.852 |
0.759 |
0.777 |
0.777 |
|
| Arizona |
0.791 |
0.687 |
0.738 |
0.689 |
0.662 |
0.666 |
0.703 |
0.703 |
|
| Boston |
0.767 |
0.827 |
0.832 |
0.865 |
0.871 |
0.821 |
0.832 |
0.832 |
|
| San Francisco |
0.739 |
0.728 |
0.842 |
0.774 |
0.866 |
0.804 |
0.795 |
0.795 |
|
| Oakland |
0.732 |
0.774 |
0.803 |
0.827 |
0.787 |
0.73 |
0.776 |
0.776 |
|
| Milwaukee |
0.766 |
0.688 |
0.745 |
0.652 |
0.678 |
0.725 |
0.708 |
0.708 |
|
| Seattle |
0.702 |
0.709 |
0.698 |
0.757 |
0.783 |
0.708 |
0.727 |
0.727 |
|
| Toronto |
0.722 |
0.756 |
0.716 |
0.737 |
0.724 |
0.734 |
0.732 |
0.732 |
|
| Cincinatti |
0.766 |
0.746 |
0.771 |
0.72 |
0.77 |
0.727 |
0.749 |
0.749 |
|
| Philadelphia |
0.742 |
0.791 |
0.833 |
0.725 |
0.782 |
0.84 |
0.788 |
0.788 |
|
| New York N |
0.699 |
0.752 |
0.699 |
0.805 |
0.723 |
0.677 |
0.726 |
0.726 |
|
| Tampa Bay |
0.667 |
0.714 |
0.8 |
0.712 |
0.713 |
0.73 |
0.725 |
0.725 |
|
| New York A |
0.723 |
0.877 |
0.803 |
0.797 |
0.842 |
0.803 |
0.811 |
0.811 |
|
| Montreal |
0.552 |
0.691 |
0.759 |
0.728 |
0.791 |
0.684 |
0.705 |
0.705 |
|
| Average |
0.768 |
0.752 |
0.759 |
0.766 |
0.782 |
0.749 |
0.763 |
0.763 |
|
The difference in OPS month-by-month is quite easily to see.
After running an ANOVA test of variance, I found that each team's monthly OPSs were significantly different from each
other. For example, during the combined months of March and April the Montreal Expos put up a weak .552 OPS, in great
contrast to their .791 in August. Besides the difference in temperature, can anyone explain why these two months are so different?
Many old-fashioned sportswriters like to credit streaks to a root cause (like team chemistry--review my older article--, weather,
or some other insignificant reason) . By looking at the spreadsheet above, no good reason can be derived to explain the
variance; except for one: randomness. You can logically call upon baseball's element of
luck and randomness to explain this situation.
The other part of "the first part" of this study was regressing to a mean. Despite the differences
in each team's OPS, every month they overall come out to an average of about .763. The ANOVA comes back to
say that all the data together is not statistically significantly different from each other. This leads to another conclusion:
you need a large sample of data to be able to judge the value of a player's performance. An OPS from April is just about worthless,
and only with about an entire season of data can you make objective decisions.
This next coming week I'll look at the postseason, and see if it is any different from month-by-month.
I hope to look at pitching performance as well as hitting, and use a multiple regression to see which of the two is worth
more in the playoffs.
Note: I ran a multiple regression to see which month has a greater effect on the entire
season OPS. Of course this has no truth to it, but according to the data August has the highest of effect. I stress that it
is totally truthless, because as we had saw it is random when a team performs well (or not so well).
What is the Postseason?
May 21, 2005
Michael Lewis's controversial 2003 bestseller Moneyball reports the theories,
beliefs, and insights of general manager Billy Beane and the rest of the Oakland Athletic's front office. In the book, Lewis
states many truths of baseball (which are disliked by many traditionalists); such as on-base percentage being worth more than
batting average, stealing and bunting being a waste of outs, and ERA playing a minor role in pitching.
In one of the chapters towards the end of Moneyball, Lewis speaks of Beane's frustration
with losing during the postseason. After three pages of rambling around to try to find an answer, Beane remarks why he doesn't
win: the playoffs are almost pure luck. The A's argument is that the postseason is so short (minimim of 3 games
for a team, maximum of 17) that a team's performance has no chance to regress to a mean. In other words, the fact a
team hit a postseason hot streak does not make that team the best in the major leagues. Performance needs time average
out, or regress to a mean. Billy Beane blames his playoff woes on the streakiness of baseball, and the lack of games played.
I hypothesize that the A's are correct here. When thought of, it makes sense that
baseball is full of hot streaks and slumps that eventually average out. The length of the postseason is less than one-tenth
of the regular season, a greatly significant difference.
Sometime during the following week I plan on looking into the subject with analysis tools.
My study will try to answer whether there is some type of relationship between the regular season and the playoffs or
not, what statistics are most consistent in terms of the playoffs and regular season, and what it takes to win during
the postseason. First, I will analyze the streakiness of baseball, and try to analyze whether they come in a random fashion,
or can be explained. Once I establish a well-infromed foundation for hitting streaks (hot and cold); I can
then tackle the "postseason problem."
This next week I'll publish two articles on the topic of the postseason. If you have any additional
questions you can send me a comment.
New Study Coming Along
May 16, 2005
This article will be brief, based on the fact that I already
wrote it and it suddenly disapeared on me.
Less than one week ago I had some thoughts about the effect different pitches, combinations
of pitches, and velocities of pitches have on player performance. The data containing pitch selections of individual players
was very hard to come by, but thanks to The Neyer/James Guide to Pitchers I have everything I need for the study.
Now all I have to do is import into a spreadsheet...
I hope to come to some interesting conclusions. The study sounds very exciting (to
me, at least) and I hope it becomes a valuable piece of information for future research.
Note: JC Bradbury, an economics professor who runs the weblog Sabernomics.com, has claimed to have created a metric that measures offensive performance without the element of luck entwined in its roots.
I've only scanned over his work, and have not looked at it in enough detail to make any judgements. However, I think that
he makes too many presumptions based on logic that I cannot in any way see there. You can read what he has to say here. I reccomend you check out what he has to say. I will post an article concerning his study soon.
Steroids in Baseball
May 10, 2005
About one week ago I received a request to post an article explaining the effect that steroids
have had on baseball at the Major League level. I am very much against steroids, and cannot believe the rampant use of
them in high schools, colleges, and minor league towns across America. They have been proven again and again to have negative
affects to a user's health and people who quit using them go through a horrendous withdrawl (just look at Jason Giambi last
season).
I have no interest in or business in describing the medical effects of steroids. My goal
would be to explain the marginal difference in production by a player juicing and a player who isn't juicing. I emphasize
the word "would" for a simple reason: It is next to impossible to explain how a player hit while on steroids without
having to explain a countless number of other variables. For example, center fielder Alex Sanchez of the Tampa Bay
Devil Rays was busted for using steroids during spring training. You can't look at his .721 2004 OPS and objectively tell
what part of it is talent and what part of it is steroids (if he was even taking steroids last season). Many variables
effect this OPS; including age, ballpark, health, if he was actually on steroids, and his actual talent. I could spend hours
of computer time trying to answer these questions using averages and regressions, but will never fully find what I'm looking
for because of the many non-absolute variables.
I'll admit, Alex Sanchez isn't the stereotypical steroid canidate that comes to
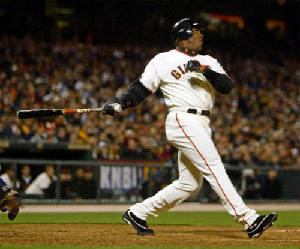
mind. We all usually think of power hitting first basemen or outfielders. Like Barry Bonds (above, left). Since
2001 Bonds's slugging percentage line (slugging is not as susceptible to variance as home runs) looks like this: .863 (the
BIG year), .799, .749, and .812. These slugging percentages are enormous, especially considering Bonds's previous high was
.688 in 2000 (the difference between Bonds's slugging from 2001-2004 and his slugging in 2000 is statistically significant, emphasizing
how his numbers from 2001-2004 are extreme). The league avererages in slugging from 2001-2004 go like this: .428, .424,
.428, and .433. These numbers compared to Bond's are very different when measured by statistical significance.
All of this about Bonds does not decide whether he's on steroids or not, but it shows
that he is playong much better than the entire league. Much, much better. I have not proven anything or made any point that
hasn't already been made. We all know that Barry Bonds is an amazing player, we just don't know whether all of it is his God-given
baseball crushing talent... (I know all about the whole BALCO allegations, but nobody can be sure)
When generally speaking about steroids in the majors, I argue that it is an impurity to the
labor market. Each player is paid on his performance and contribution to his team, and placing yourself unnaturally above
the game completely disturbs the economics of baseball. I hope that Commisioner Bud Selig continues to scowl at steroids
and other types of substance abuse. The game really needs to be cleaned up.
This topic always stirs a lot of emotions, so if you would like to share yours please visit
the comments page by clicking at the picture of Bonds above.
Value of a Reliever
May 5, 2005: Cinco de Mayo, Holocaust Rememberance Day
People around the world are remembering (some joyfully, others sorrowfully) important events
that shaped the lives of millions. I don't carry with me any type of fantastic news that will make a lasting impact on the
world, but I do bring my study of relief pitchers to the site. The study found its beginnings about a week ago, and has been
finished for a period of only just over five minutes. My goal was to objectively find the value of a reliever pitching
just one inning (like Francisco Rodriguez or Eric Gagne would do in the ninth). Thanks to the easily imported data
from ESPN.com and the miracle-holding Excel spreadsheet, I completed the job and have much to share.
Apporoximately 10 days ago I brought the idea of assessing relief value to the site in an
article contemplating the difference in the relationship that Francisco Rodriguez and Average Reliever have towards winning.
I hypothesised that the relationship (between winning percentage--variableY-- and relief performance--variable X--) is
non-linear, and it turned out that I was correct. This meaning that a straight line cannot be formed using the
points given in the scatter plot. An increase of, say, 100 of stat x does not mean that you will incrementally win more games
at a fixed rate. The scatter plot for my data can be seen on the spreadsheet, and is best described using a non-linear
fitting (although a linear plot would be ok)
This being established, we know that a non-linear function is needed in order to find the
relationship between a pitcher's stats and winning. Microsoft Excel gives us an endless amount of tools, and their Exponential
Growth (GROWTH) is perfect for this occasion. Once you plug in our X and Y variables, it will tell you the expected winning
percentage a statistic's value is worth. Rodriguez's .042 MLDIP gives him a "expected winning percentage" of 1.028, while
Lance Carter's .269 MLDIP yields a .311 "expected winning percentage."
The expected winning percentage we receive after the GROWTH function is much more refined
and mature than the raw numbers we started with, but this has little value in determining a reliever's value pitching one
inning of one game. First by analyzing the average start of a starting pitcher (5.82 innings) and then subtracting it
by nine (nine innings in a game), you will find the average number of innings in relief. After a few more
transformations you will finally reach the percentage of a game one inning of relief acts as, and that number happened to
be .035 in 2004.
Once the GROWTH winning percentage and the one inning relief percentage are multiplied
together, the one inning pitching value is found. I ran the formula on Francisco Rodriguez and his value pitching one
inning of relief is about 4%. This may seem like a trivial number, but is most certainly not when considering the
starter throws about six innings and the hitter's contribution on the offensive side. One thing that this does not inlude,
however, is the "ninth inning effect" where a closer can end a game. Something to think about for next time...
I'm very satisfied with the outcome of this study, and thankful that ESPN had all the
proper data. I wouldn't be surprised that this can somehow apply to monetary value, and
would be a good economic indicator in the relief market. In the future I may revisit this subject, as once I had finished
my head flourished with new ideas. I'd love here your input and questions on my comments page. Below is a link to download my spreadsheet (nowhere near as large as the last one).
By the way, the average reliever's value was 1.8% when pitching one inning.
Relief Value Spreadsheet and Graph
Team Chemistry in Baseball
May 4, 2005
This is the second article in my series explaining baseball's "hot-button issues." Last post
objectively analyzed the myth of clutch hitting, and this one will cover team chemistry. I know that this is a fragile subject
for some people (there are a lot of people who would be mad if I told them that the Anaheim Angels didn't win the 2002 World
Series because they were "close-knit") but I will still write in the way that I do. Your opinions can be voiced on my comments page.
Sometime last summer I theorized to myself that it is not the team chemistry that causes the
winning, but rather the winning that leads to team chemistry. In other words I said that if a team is playing well and winning,
of course the players are going to be happy and support each other! Performance is key in baseball, and the sad truth is that
heart and soul plays a minor role in winning games. There is a great New York Times article explaining a psychologists take on team chemistry and winning (which happens to be almost identical to mine).
It is almost impossible to analyze this issue with data, so the next best thing would be logical
thinking and assumptions. Along with what is stated above is the fact that teams that win games happen to be good teams. It
is very rarely that a team "full of heart" but has no talent at all will win 95 games and make it to the World Series. If
you ask me, it just doesn't work that way.
This has been a shorter article in length, but is so rich in content that it is quite
a bit to think about. I personally think team chemistry has little effect on the outcome of games, but that can certainly
be debated. My view is that I'm not going to believe in team chemistry until someone else proves its existence,
which I find highly improbable. Read the NY Times article linked to above, think about what I have to say, and
make an opinion for yourself.
.TK and Domain Problems
May 4, 2005
I was trying to visit this site yesterday (to write a new article) and realized the when I
typed in the URL, mlbstathq.tk, it came to an ad then the site. Apparently when you use the .TK (Tokelau) domain
it supplies ads on your website, something that I was not aware of.
If you would like to bypass the ad then you can visit the following URL rather than the one
above: sabereconomist.tripod.com. Tripod is the web-host that I set the site up with, and I've been pretty happy with it.
I apologize if this has been any inconvenience to you. It looks like I didn't do my homework
on this one, and went for the free domain name rather than paying for something of quality. In the next week I'll research
domain information and find a suitable service for the site.
(This article is as appears in email to subscribers)
Sorry, been busy lately
May 2, 2005
Two days ago I composed an article giving you a timeline of when I will post, and what each
post will cover. Well, as it turns out, I've been busy lately; and that schedule is not realistic.
I will try to write an article--the one analyzing relief pitching value--tomorrow or
Wednesday to post on the site, and on Saturday my major defense-independent pitching study will be unveiled. Expect the article
continuing my series on baseball's "hot-button issues" to arrive somewhere in the mix.
Because of how I (and many others) have a schedule that can change rapidly in a day,
I will most likely not give such a timeframe for posts again in the future. I will do my best to keep the site updated about
twice a week, and will continue to send email notices to all people on my email update mailing list (you can
sign up on the site information page).
Until I post my relievers study I suggest you take a look at some of the websites on my links
page ("Other Great Sites and Blogs" on the quick bar to the right). Sabernomics has some great work on it, but is not updated
as frequently as some people would wish. You can click on the picture above to the right to view my links page.
What's to Come
April 30, 2005
The week is now over. The world saw the Yankees and Red Sox struggle with injuries (and suspensions), witnessed
with great unbelief the White Sox' pitching continued success, and sat on the edge of their seats as Roger
Clemens lost another 1-0 game. Quite a lot to talk about, especially when you consider that we're speaking of
only seven days of the 26 week long baseball season. Games will continue to be played, and this site will continue to analyze
the game. Here is what I hope to see arrive at the site for you to read:
Tomorrow-- an article on relief value. This is the
conclusion to the study I spoke of conducting a couple of days ago when I questioned the value of the relief
role towards winning. Turns out my hypothesis was right: the relationship is not linear.
Mid-week-- continuing the series on the much debated topics of baseball. My
last article was on clutch hitting; which turned out to be very successful; and my next one will cover either team
chemistry, base stealing, offensive metrics, bunting, or something along those lines. If you'd like, you can email me and tell me what topic you would prefer see on the site.
Next weekend-- the defense-indepent pitching (DIP) article I've been promising.
Earlier this week my MLDIP metric was unveiled, and now I will write an explanation of it; covering the background of DIP,
how my stat came to its being, and MLDIP's compliment--MLDIP forecasted runs above average. This article should be a
bit lengthy, but will include fascinating content that you cannot receive anywhere else on the web.
Well, that's what's on the way. I've had a fantastic first
week of writing on this site, and I believe it should continue. As the season goes on you will see more of
my studies, which you will hopefully enjoy. I highly appreciate the following that the site has received, and I'd like to
once again invite you to comment on the "comments" page or email me directly. Thanks!
Clutch Hitting--and baseball's many other questions
April 28, 2005
My next few posts will be on the basics of baseball, the little things that draw so much attention
from the baseball community. These aspects of the game are disputed amongst "old-timers" and statheads across the
country, never agreeing on anything. In these articles I will offer the objective view of these issues, and you may comment/argue
with my conclusions as much as you like.
This article will be dedicated to the well-known idea of clutch hitting. The very thought
of "clutch" players is fantastic, and this is most likely how it arrived to our minds. Many sabermetricians have analyzed
data, and concluded that their is no strong evidence supporting that some players hit better than others in
pressure situations.
I ran my own short study (small data sample--remember), comparing individual players' "MLB
late and close" data year-by-year (2002-2004). Here it is:
| 2004,
2003, 2002 Clutch situation data (MLB late and close) |
| Player |
04 OPS |
03 OPS |
02 OPS |
stdev OPS |
mean OPS |
| M. Young |
0.770 |
0.454 |
0.804 |
0.193 |
0.676 |
| M. Alou |
0.375 |
0.809 |
0.530 |
0.220 |
0.571 |
| C. Patterson |
0.514 |
0.494 |
0.627 |
0.072 |
0.545 |
| A. Ramirez |
1.140 |
1.250 |
1.422 |
0.142 |
1.271 |
| T. Redman |
0.889 |
0.810 |
|
0.056 |
0.850 |
| C. Wilson |
0.969 |
0.351 |
0.829 |
0.324 |
0.716 |
| D. Lee |
0.863 |
0.718 |
1.036 |
0.159 |
0.872 |
| M. Lawton |
0.663 |
0.647 |
1.192 |
0.310 |
0.834 |
| R. Winn |
1.121 |
0.643 |
1.194 |
0.299 |
0.986 |
| D. Jiminez |
0.602 |
0.885 |
|
0.200 |
0.744 |
| M. Kotsay |
0.422 |
0.828 |
0.626 |
0.203 |
0.625 |
| J. Lopez |
0.659 |
1.045 |
0.849 |
0.193 |
0.851 |
| H. Matsui |
1.188 |
0.929 |
|
0.183 |
1.059 |
| M.Barrett |
0.886 |
0.517 |
0.587 |
0.196 |
0.663 |
| D. Bautista |
1.057 |
0.812 |
0.717 |
0.175 |
0.862 |
| A. Beltre |
1.105 |
0.688 |
0.949 |
0.211 |
0.914 |
| V. Castilla |
0.818 |
0.623 |
0.290 |
0.267 |
0.577 |
| J. Wilson |
0.832 |
0.381 |
0.488 |
0.236 |
0.567 |
| Average |
0.826 |
0.716 |
0.809 |
0.060 |
0.784 |
Notice the standard deviation (measure of variance) is significantly large. After running
an ANOVA test on the data the assumption of clutch performance being "random" is confirmed, because their is no significant
pattern.
You could argue that players like Aramis Ramirez, who performed exceptionally well in clutch
situations all three years, are clutch players. I would refute this assumption by mentioning the fact that
baseball is filled with luck and randomness, and someone is bound to perform well under these circumstances. While
the data above is not much, it certainly supports the thesis that clutch players do not exist.
Another dimension of clutch performance is the psycological aspect. I have no reason to believe
that a player batting in the third inning, with his team up by five runs, would not play as hard as a player
batting in the bottom of the ninth, with his team down by one run. The major league level is so compettive that I highly doubt
this occurs.
Despite what I and many other people have presented; many commentators, fans, and even general
managers value players by their "clutch hitting." The myth about clutch hitting is not that clutch hitting does not exist--of
course clutch situations occur--it is that no player is significantly better than another in this department. Hitters should
be valued by their production over the 500+ at-bats of the regular season, not the 40 at-bats they receive when the game is
on the line.
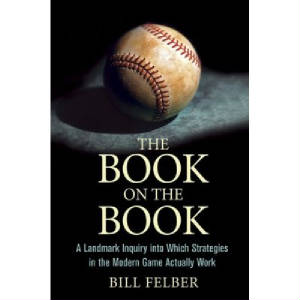
Announcing: A Book Review!
April 27, 2005
I got tired of watching the longest, ugliest Boston Red Sox game of the year, so
I went to the local Barnes & Noble last night, and bought a book cleverly titled The Book on the Book.
Written by baseball journalist and researcher Bill Felber, the book's objective is to pick up where Michael Lewis left off
in his 2003 "classic" Moneyball. Felber aims at using data to analyze the unwritten "book" that governs the actions
of managers, gm's, and owners all over the league. This new book is filled with great statistical analyses,
formulae, and offbeat equations that can be appreciated by stat nuts and casual fans alike.
I've decided that once I finish it I will post a review of both the both and some of
the metrics Felber introduces on the site. One of these statistics is earned value, or EV, which uses a linear equation to
judge how much a player earned based on performance. I'm skeptical of this, however, because it is pretty well agreed
on that the Major League Baseball market is not linear; and while this is an earned value metric, it has no real
significance. I have not read the entire chapter on EV, so my current opinion of it is not as informed as it should be
to make a judgement.
This one fact has not discouraged me. This book is overflowing with great content, and addresses
virtually every aspect of baseball that Michael Lewis missed (Lewis spent chapters drilling the importance of OBP into
the reader, leaving out many other dimensions of baseball). Felber also writes in an easy to read, humorous way which makes
the book much easier to read for the average fan.
Expect the review in a week or two. You can see it at Amazon.com by clicking on the picture
to the upper-left. I bought it for $24.95 at Barnes & Noble.
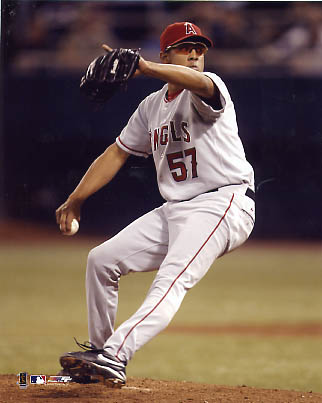
K-Rod and his Value
April 25, 2005
Right is a picture of K-Rod, Francisco Rodriguez. Last night
I was watching the ESPN broadcast of the A's v. Angels game (what a great one!) and Franky Cordero came in to close in thge
ninth. I've seen him pitch many times before, but never quite noticed his dominance in a 1-0 game. This got me thinking about
the value of different relievers towards a win. I would take a guess right now that the relationship to winning between a
Tim Worrell and a K-Rod is not linear. I've been greatly motivated by this and will probably start working on this problem
soon.
2004 MLDIP Individual Pitching Statistics and MLDIP Intro
April 24, 2005
Below is a download to a spreadsheet featuring my one-month new statistic, the Model of Linear
Defense Independent Pitching (MLDIP). This stat is equalized by season and opportunities through Forecasted Model of Linear
Defense Independent Pitching Runs Above Average (FMLDIPR). In both metrics lower is better.
The formula to MLDIP: Homeruns+(Walks+Hit-by-pitches)*.425186+Strikeouts*-.07894
---------------------------------------------------------------------------------------------------
Homeruns+Walks+Hit-by-pitches+Strikeouts
The forecasted runs model includes a forecast function. This will be explained in depth in
another article coming soon
Soon I will be writing an article covering all of your questions in detail. If you would like
to learn more about defense-independent pitching before-hand you can see here.
The download underneath this article is a spreadsheet, so I would advise you
not to mess around with its functions once opened (no deleting, etc.). A database (Microsoft Access most likely) will
be added in a week or so. If you have any additional questions send them to me by going to my comments page and I will make
sure to answer them in the article to come.
Click here to download MLDIP spreadsheet
|

